You may already know how easy it is to create a Web page that accesses data on the iSeries. When your application is created using Active Server Pages (ASPs), this ability is enhanced by the ability to use ActiveX controls within your ASP. A great example of this is to use the charting object included with the Microsoft Office Web Components (OWC) to create a chart or graph from your iSeries data within a Web page. In this article, you'll explore using OWC charts within an ASP.
Software Requirements and Setup
To use the examples within this article, you'll need a Windows server running Microsoft Internet Information Services (IIS). In addition, you'll have to install OWC on the Web server. If you have Microsoft Office, you can install this from the Office Setup CD, or you can download OWC from the Microsoft Web site. Once you've installed OWC on your IIS server, you're ready to go.
OWC Chart Object Model
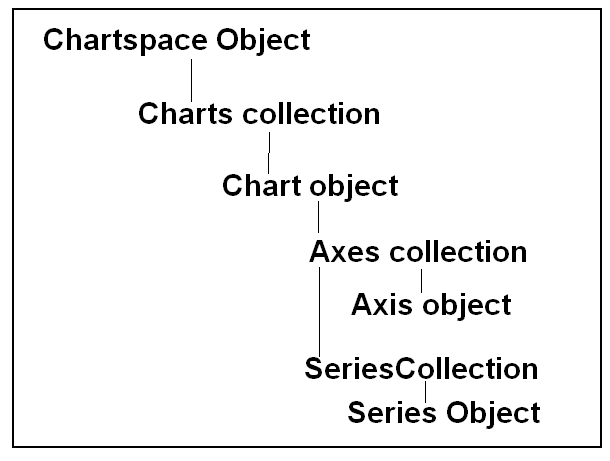
The OWC Chart component is a simple ActiveX control that allows you to create a graph or chart. If you're familiar with creating graphs and charts in Microsoft Excel or any other spreadsheet package, the concept behind the OWC chart object won't be too foreign to you. Figure 1 shows a graphic representation of the OWC chart object model.

Figure 1: The OWC Chart component allows you to create a chart. This is the OWC Chart object model. (Click images to enlarge.)
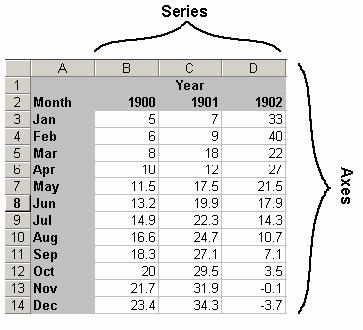
As this figure shows, the base component used for creating a chart is the Chartspace object. One Chartspace object can contain multiple Chart objects within a Charts collection. The Chart object's data is supplied through the Axis and Series objects. Figure 2 shows a sample of what the Axes and Series represent within your data.

Figure 2: This example illustrates what the Axes and Series represent within your data.
In this example, Series represents the number of columns within your data. Axes represents the rows within each column. In the example above, 1900, 1901, and 1902 represent the three items within the Series collection. The months and their corresponding values represent the Axes within the object.
Creating Charts Server-Side
When using the OWC Chart component, you have the option of creating the chart on the Web server or within the client browser. There are pros and cons to each of these. If you create the chart server-side, you need to have the OWC component installed only on the Web server, not on each client PC that accesses the page. On the other hand, a client-side chart can be changed dynamically through client-side VB Script or JavaScript code. One main difference between the two techniques is that, while the client-side technique loads an ActiveX control into the browser window, the server-side technique simply displays the chart as an image file. For the examples in this article, I'll be focusing on the server-side technique. For more information on the client-side technique, see the book Active Server Pages Primer from MC Press.
Using the Sample Application
Before you get to the actual code for this example, you'll need to go into the root HTTP folder on your IIS server (usually, this will be c:inetpubwwwroot) and create a subfolder named ASPChart. You'll use this folder to store your source code and the temporary image files that will contain your charts. Figure 3 contains the source for the file "global.asa." Place it in the folder you just created.
|
Figure 3: This is the code for the file global.asa.
This file is used to create script source to be executed whenever the page loads. The example here contains two VBScript functions: Session_Onstart, which is executed each time a user creates a new session by logging into any Web page in this folder, and Session_OnEnd, which is run when a user ends a session by closing the browser or navigating away from the Web site.
This file can also contain Application_OnStart, which is executed the first time a user accesses the page and each time the IIS server is restarted, and Application_OnEnd , which occurs when the IIS server is ended.
Within your OnStart event, you need to do several things. First, create a Session variable that contains a Scripting.Filesystemobject ActiveX control, which can be used to manipulate files on the Web server. A Session variable can be accessed anytime throughout a user's "session" as described above, even from a different ASP. Next, create a second session variable, which will act as a simple counter to be used later. Finally, set the session timeout to one minute. This will cause the session to expire if no activity occurs for one minute.
The Session_OnEnd event performs cleanup tasks by using the two session objects created earlier to delete the temporary image files created during the life of the session using the .Deletefile method of the Scripting.Filesystemobject. The parameter supplied points to session variables containing the names of each of the image files created by the application. Figure 4 contains the source for ASPChart.asp, which is responsible for actually creating and displaying the chart.
|


