You won't regret taking this proactive approach to monitoring performance!
How do you know what level of performance is acceptable for your IBM i server? What's an acceptable average for response time, database and non-database fault rate, number of seizes and locks, or average disk rate? Many of us don't even know what an acceptable CPU percent is on our server.
Even if you know the metric average that you want, how is your team warned when you exceed a threshold? Do you get a report from IBM later in the week? Does your administrator or operator record this information manually so you can compare it to last week?
The reality is that most of us don't know what's normal for our systems when it comes to performance metrics. Often, this is because "normal" on one system, disk unit, or memory pool is "abnormal" for another as a result of stricter Service Level Agreements (SLAs) on one or the other.
If it's my shop, I want to know about potential problems before they become a reality. Many customers tell us that each operator manually records CPU, DASD, average response time, and other performance statistics during their shift. If you really want to know the health of your system, you need a tool that can read system performance information continuously, summarize it, and then compare it to a reasonable threshold.
Automate System Performance Monitoring
The Robot/NETWORK Performance Center has attracted a lot of attention since its release. That's because we've made performance monitoring on IBM i simple. By integrating it with our product consolidation tool, Robot/NETWORK, you can take advantage of escalation and notification processes you already have in place.
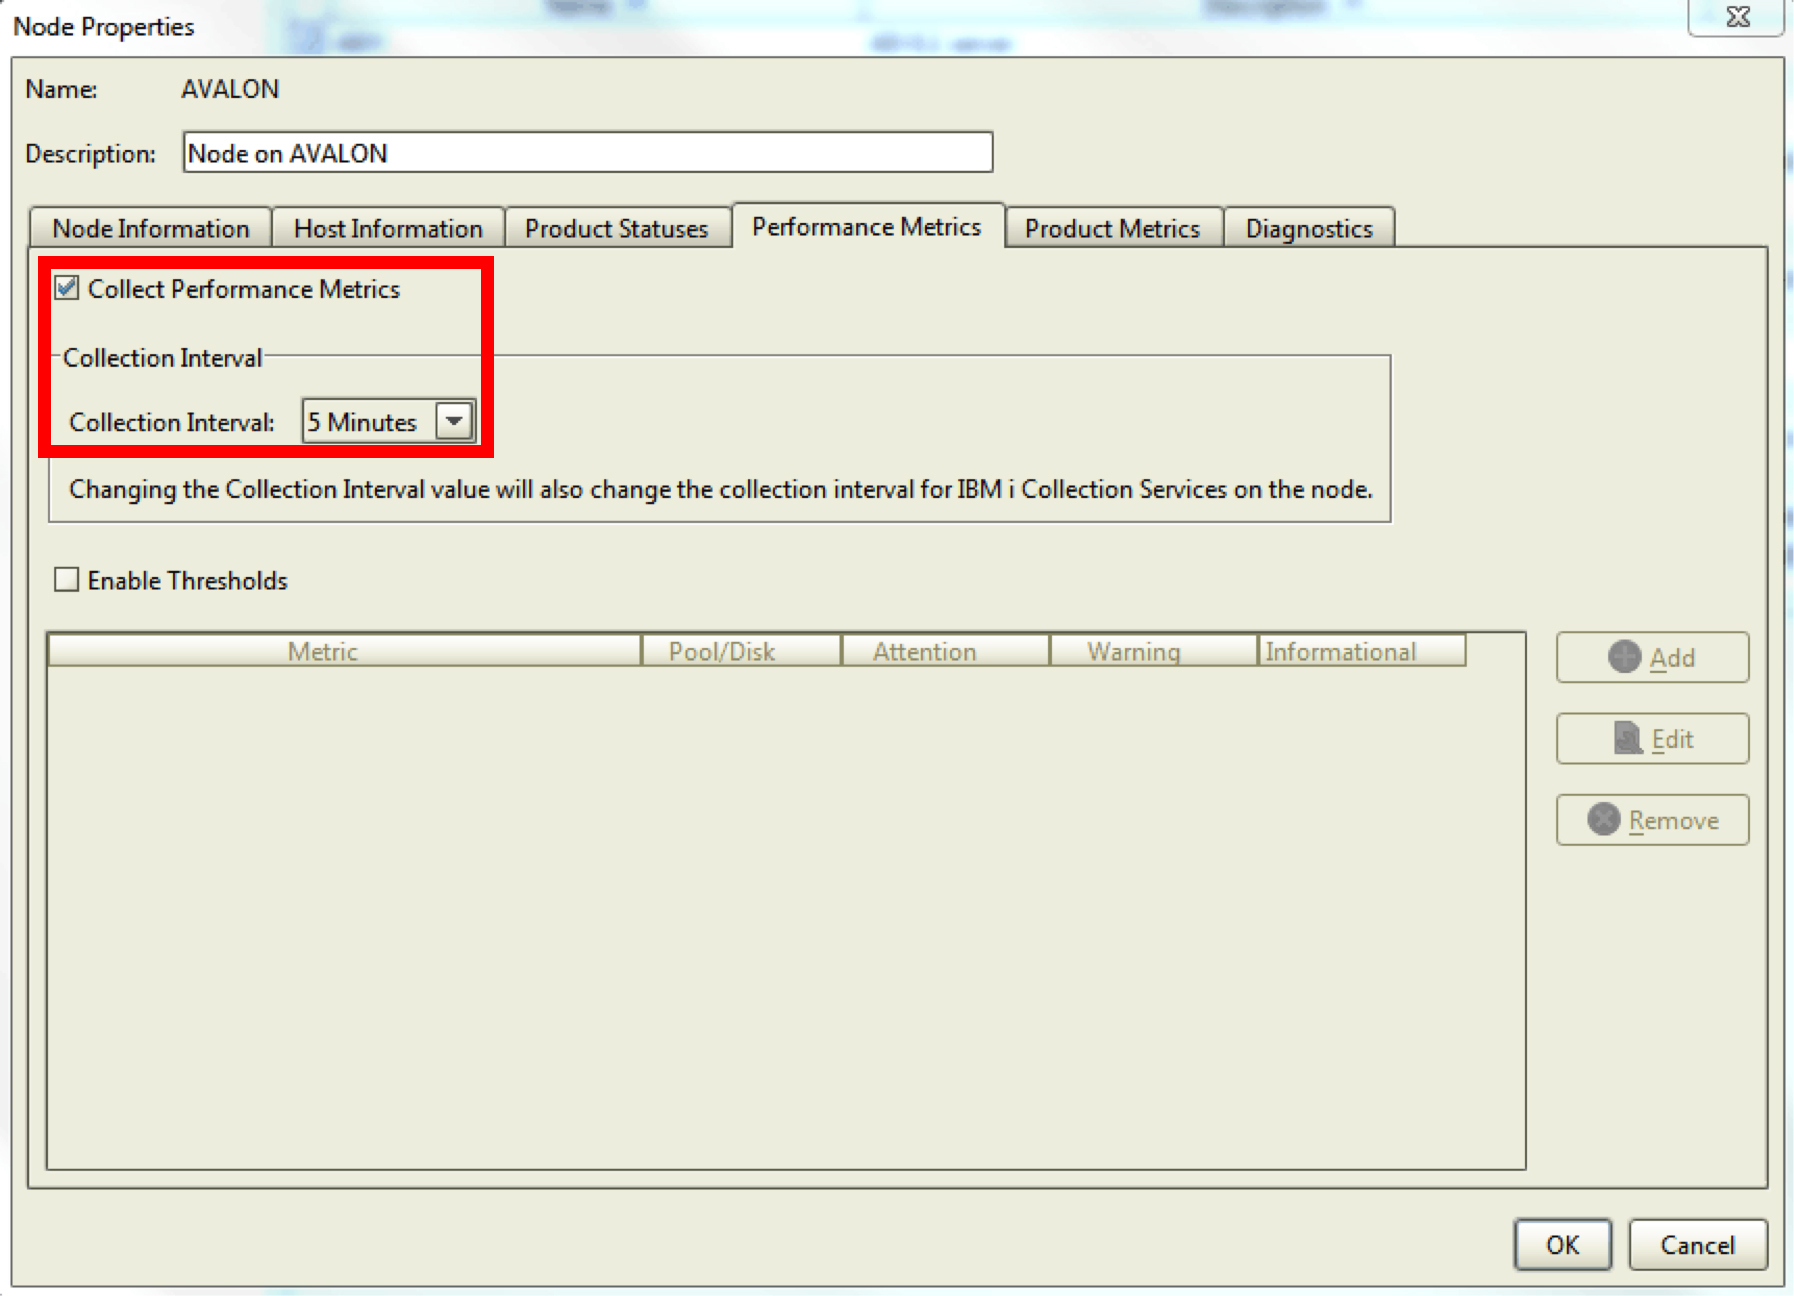
Performance Center's dynamic, drill-down-capable dashboards, graphs, and charts keep your finger on the pulse of your system's health. Plus, you get more control over that data with Performance Center's abilities for exception notification, multiple thresholds, and more. Simply turn on Collection Service and Robot/NETWORK continuously gathers this information across your network of IBM i partitions.

Figure 1: Establish performance collection interval.
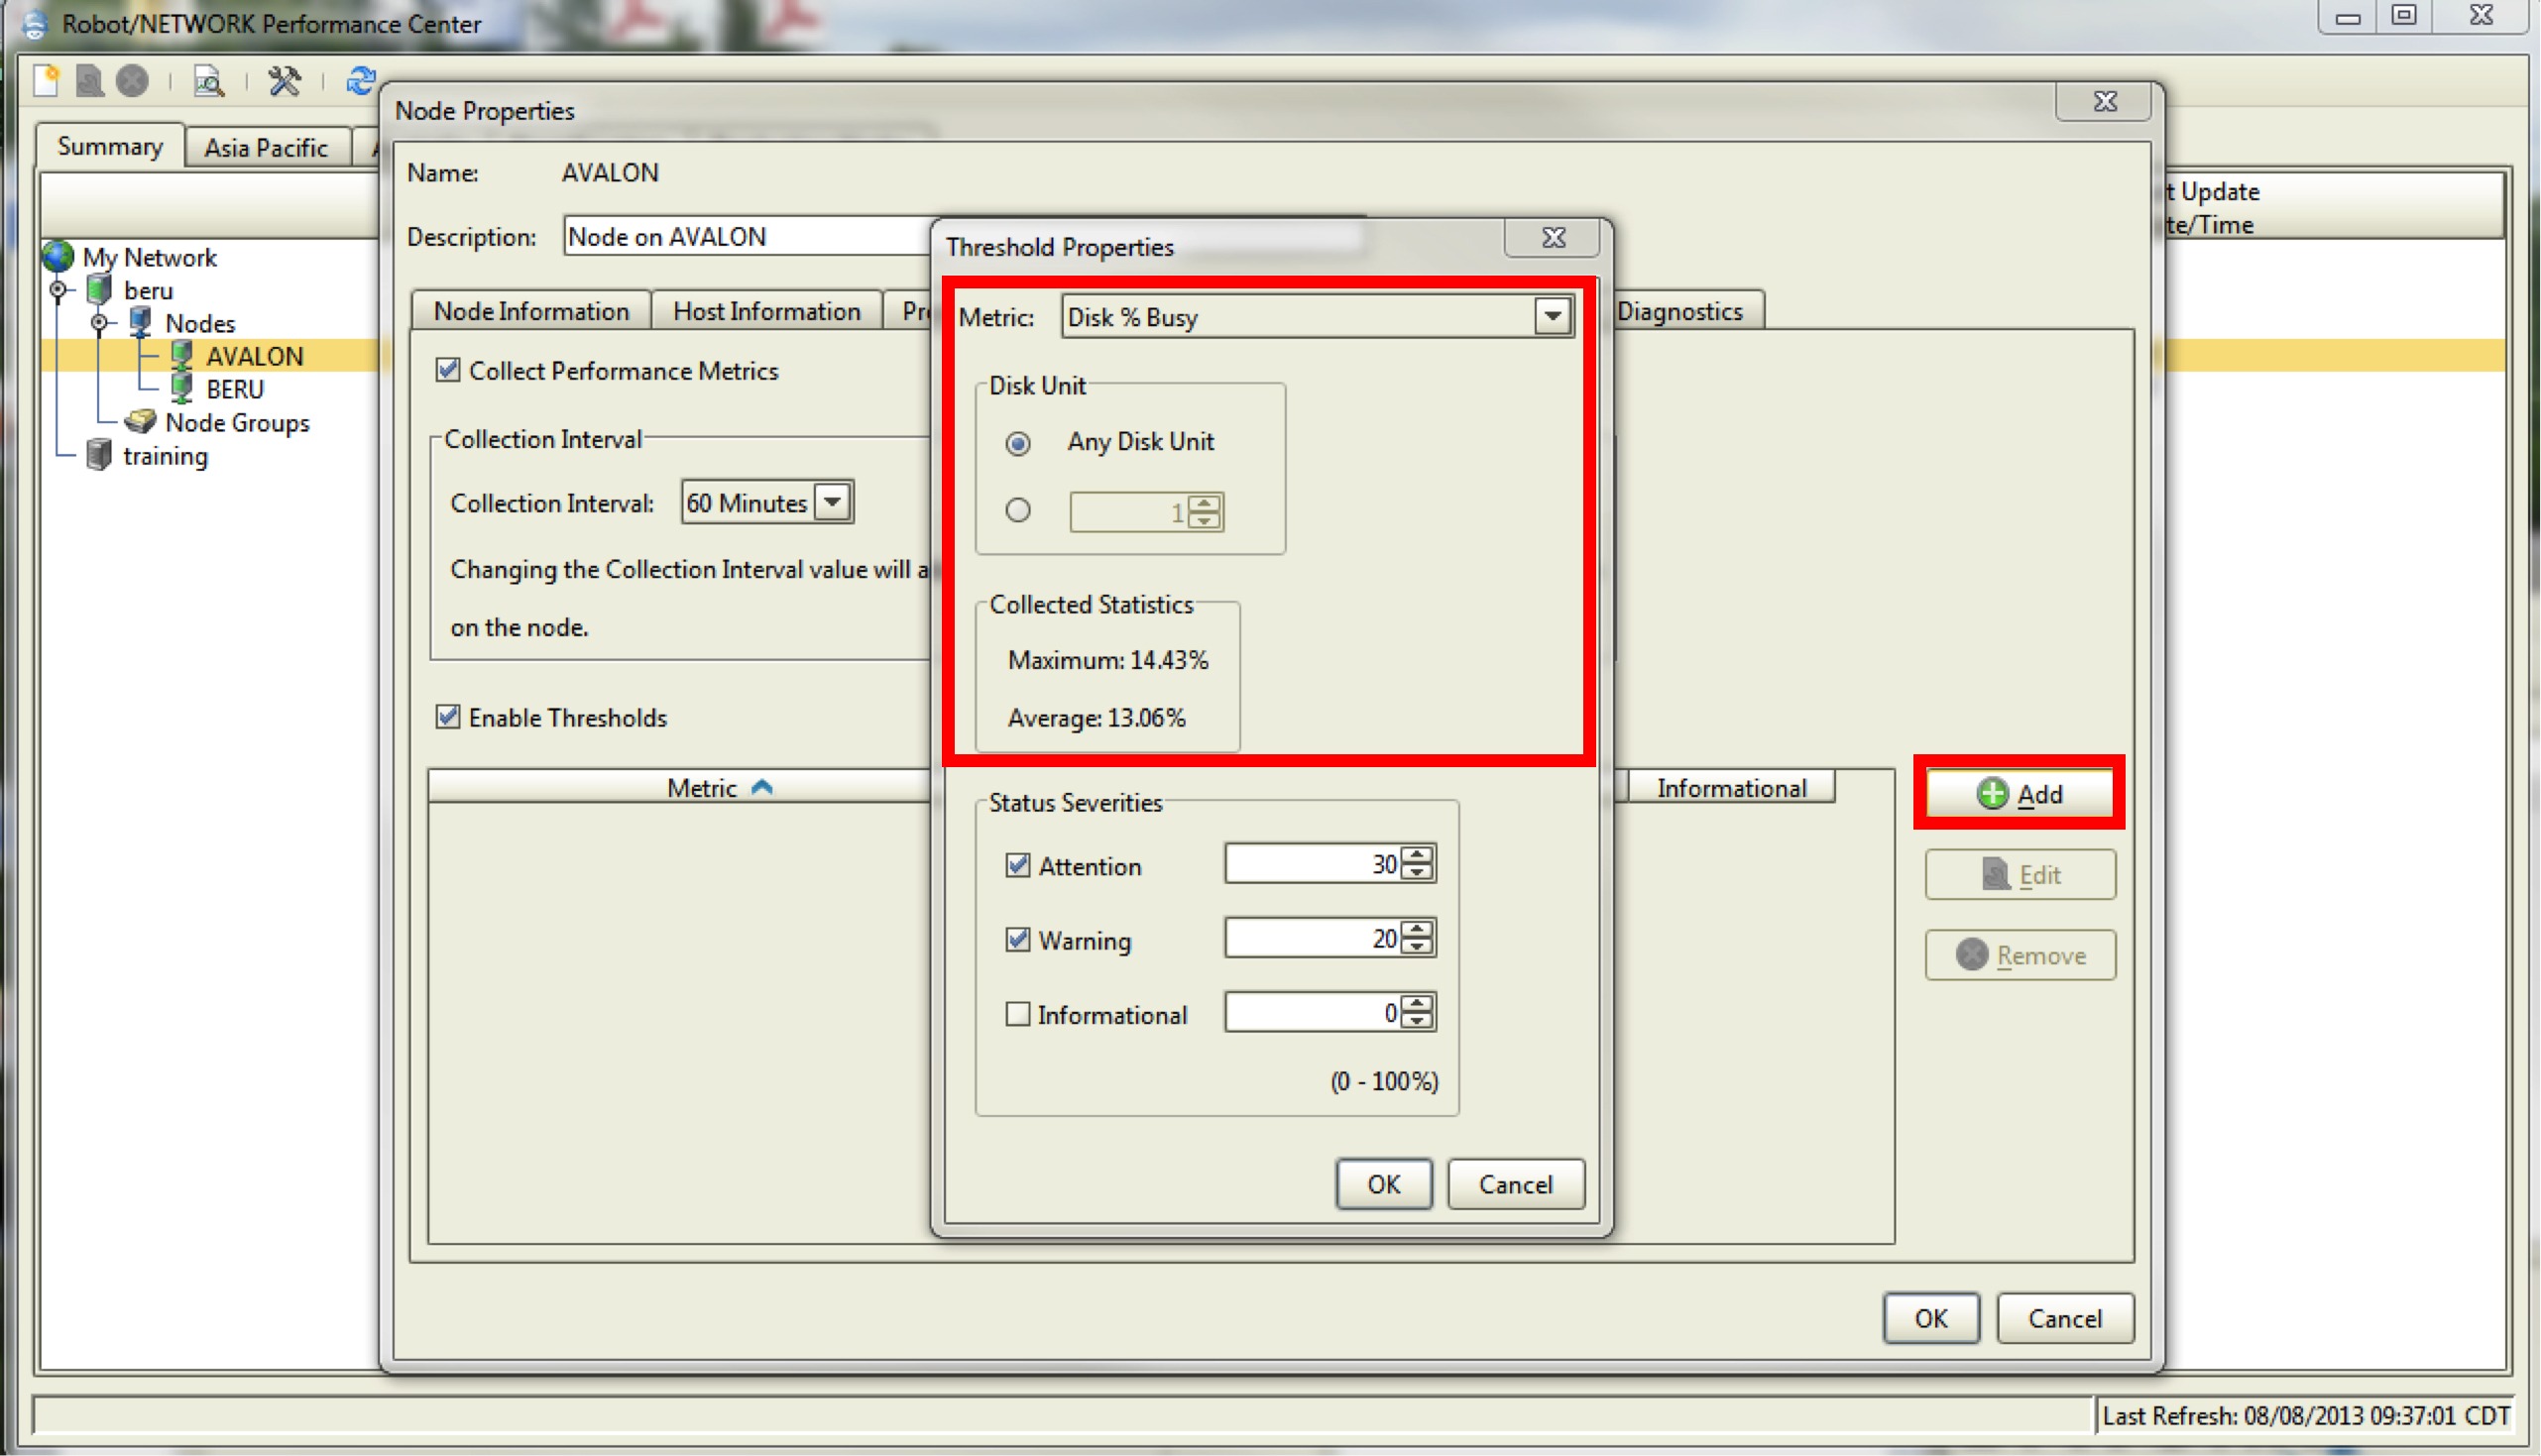
With Robot/NETWORK collecting your performance statistics, you'll have access to present and historical maximums, as well as average values, for the metrics you want—a great place to start when setting your threshold value.

Figure 2: Set threshold for “Disk % Busy” or any other performance metric.
Exceeded thresholds will automatically show up in the Robot/NETWORK Status Center (in corresponding color on the Map Center). An operator must acknowledge these messages or—if you're escalating to email via Robot/ALERT or using built-in SNMP escalation without monitoring the Status Center—you can automatically acknowledge the messages using the RBTNETLIB/RBNACK command in a scheduled job.

Figure 3: View performance exceptions for thresholds to alert your systems admin team.

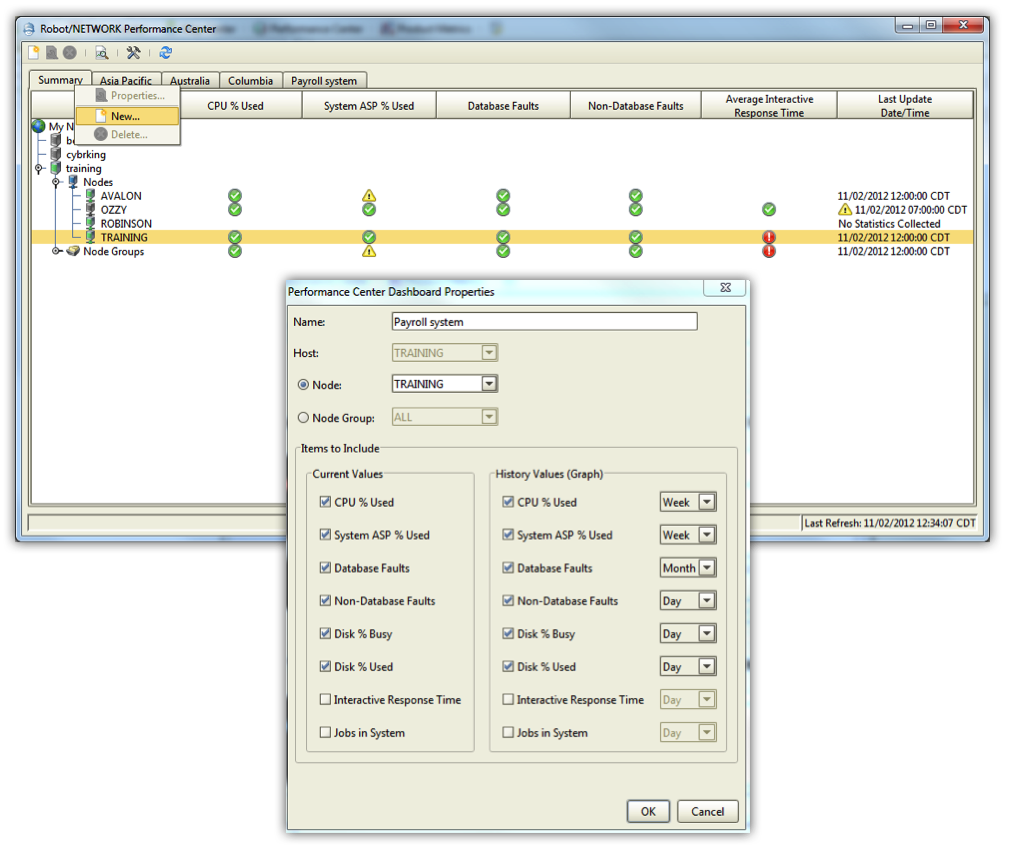
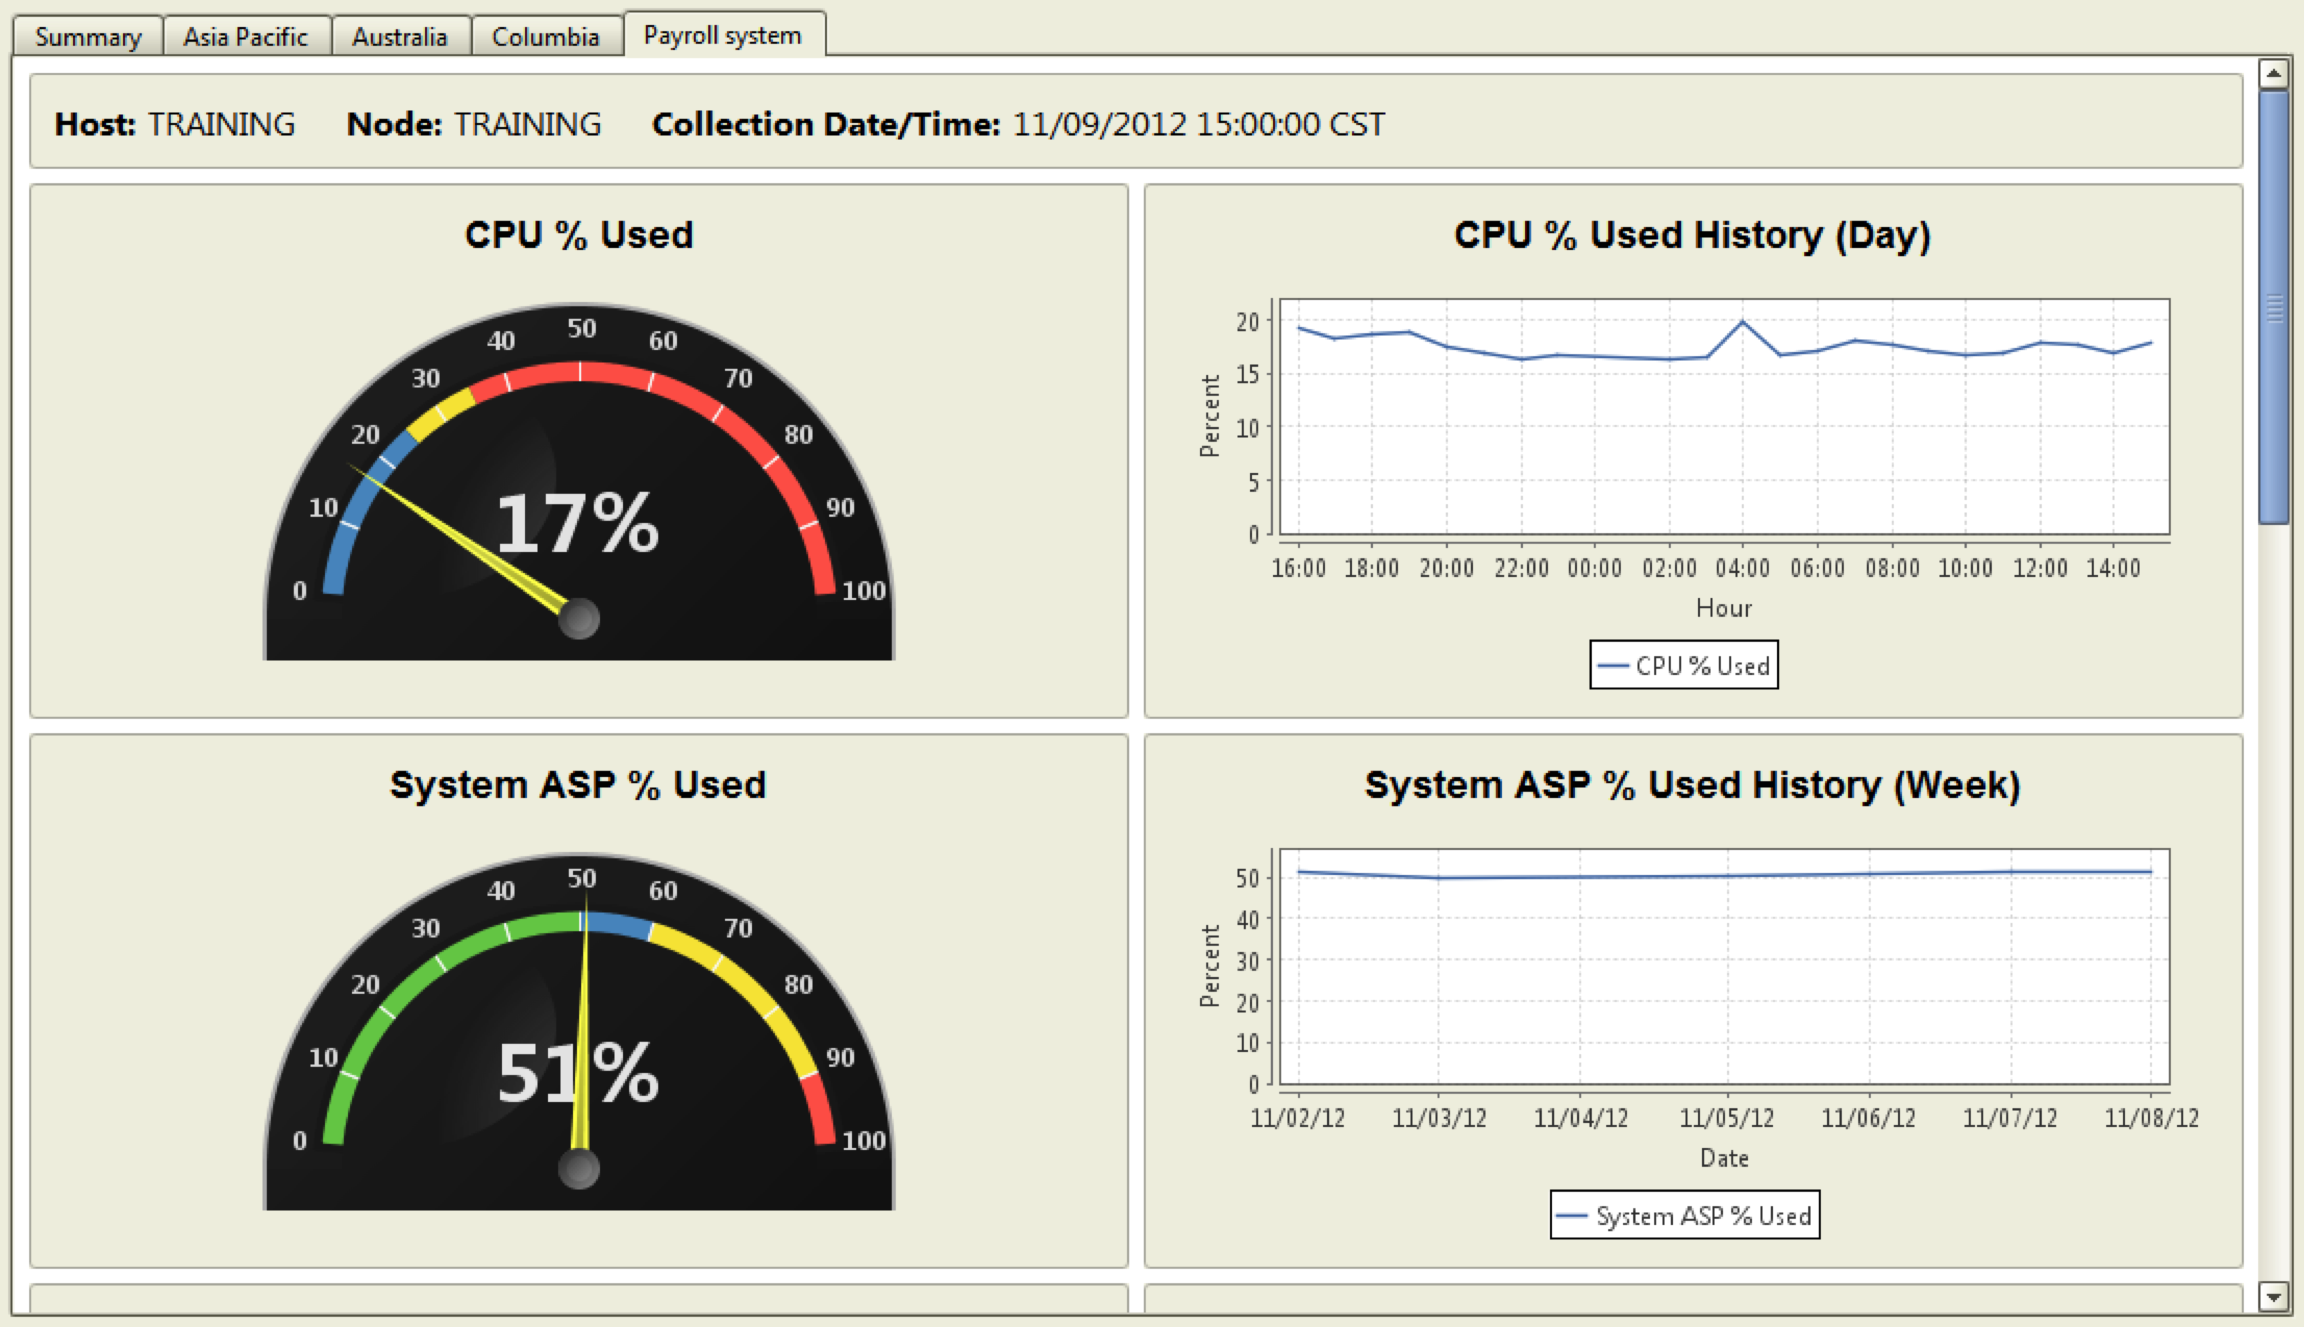
Figure 4: Create your own dashboard to view stats for one partition (as shown in Figure 5) or multiple partitions.

Figure 5: View dashboard with periodic updates.
To refine your performance monitoring even further, use the guidelines in our white paper, "Analyzing IBM i Performance Metrics", plus expect new, helpful features and functionality in the Performance Center next year. You may also experience how Robot/NETWORK will benefit your environment by setting up a free, 30-day trial. You won't regret taking this proactive approach to monitoring performance!


LATEST COMMENTS
MC Press Online