Have you ever had performance problems on your iSeries in which the CPU is barely being utilized but users are complaining that their jobs are running more slowly than usual? You could be running into seize/wait conflicts. Seizes and locks can sometimes be a cause of significant wait times on your system. This document explains the difference between a seize and a lock and identifies how to determine whether seize/wait conflicts are occurring on your system.
Understanding Seize/Wait Conflicts
The iSeries allows many jobs to access an object simultaneously. Conflicts can occur when a job is waiting for a record that is locked by another job, waiting for a data queue that is being updated, or waiting to use a database file while its index (access path) is being updated, just to name a few.
Frequent object creates and deletes can cause seizes on a user profile or library containing the object. For each object being created or deleted, the owning user profile needs to be updated. For example, a lock on a program can occur if a user is using SQL. The optimizer has to lock the program in order to write the access path back to the program where it is stored.
Fortunately, the system has controls in place to ensure that only one job can update any particular object at a time. These controls, called seizes and locks, reserve the object (or part of it). Seizes occur below the Technology Independent Machine Interface (TIMI) level on the iSeries, and locks occur above it. You can identify if a job is holding a lock on an object by using the WRKOBJLCK command. Sounds simple, doesn't it? But here comes the hard part. There's no command to see a seize because seizes occur below the TIMI. If you can't see a seize, how can you determine whether a seize is occurring on your system?
Identifying Seize/Wait Times
If you are running Collection Services to collect performance data and are creating the performance database files, you have the information right at your fingertips. Using the WRKQRY command, you can create and run a query over the QAPMJOBL file for a particular member to determine whether high seize/wait times are occurring on your system.
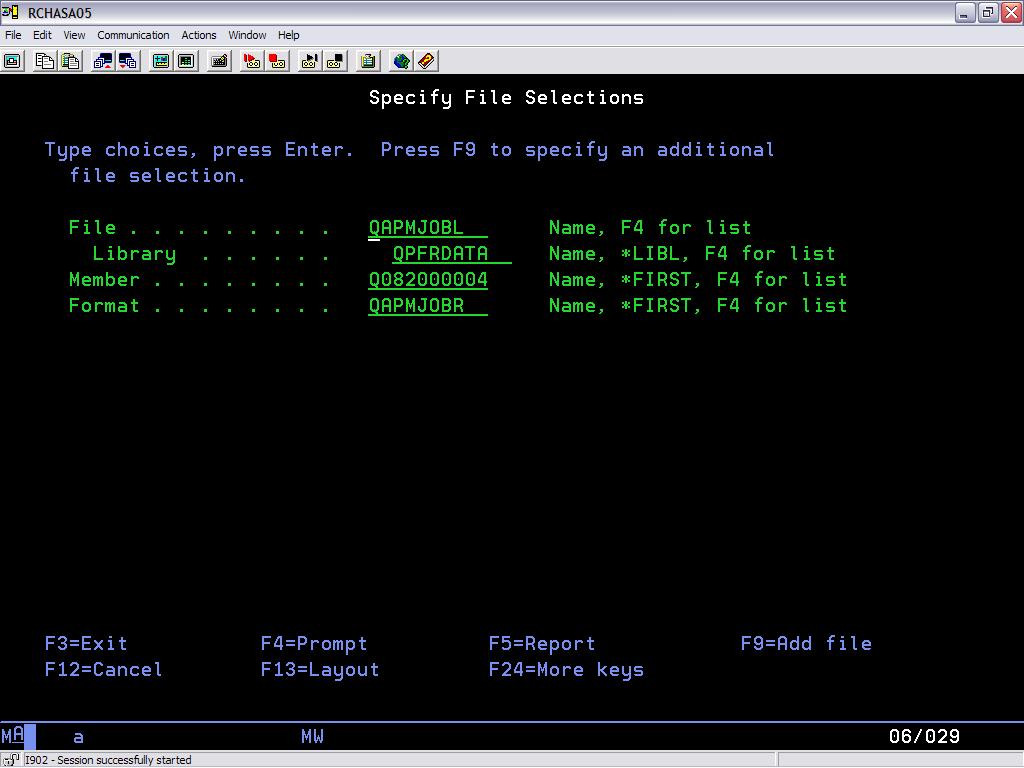
When creating your query, make sure you are looking at the QAPMJOBL file in your particular performance data library (Figure 1). If you're not sure which member to select because you're not sure when the problem is occurring, start with one of the more current members.
Figure 1: Be sure to use the QAPMJOBL file for your query. (Click images to enlarge.)
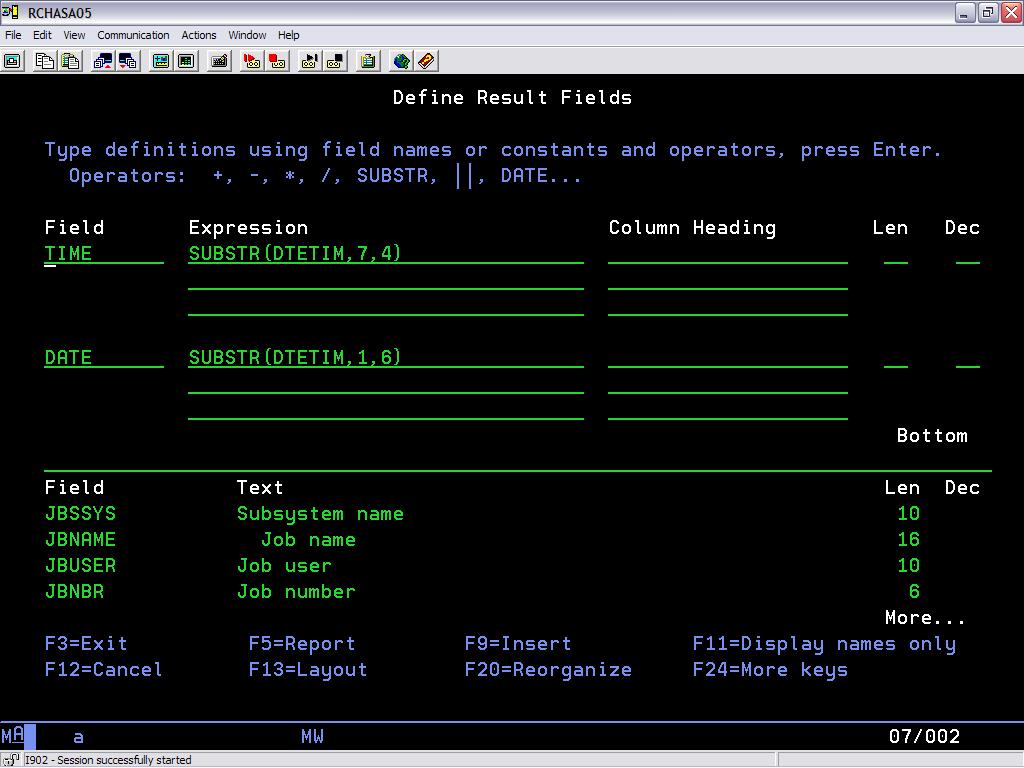
To make it easier to pinpoint the problem's specific timeframe, you can substring the DTETIM (date/time) field into two separate fields, DATE and TIME, by entering the following on the Define Result Fields panel (Figure 2):

Figure 2: Substring the DTETIM (date/time) field into DATE and TIME fields.
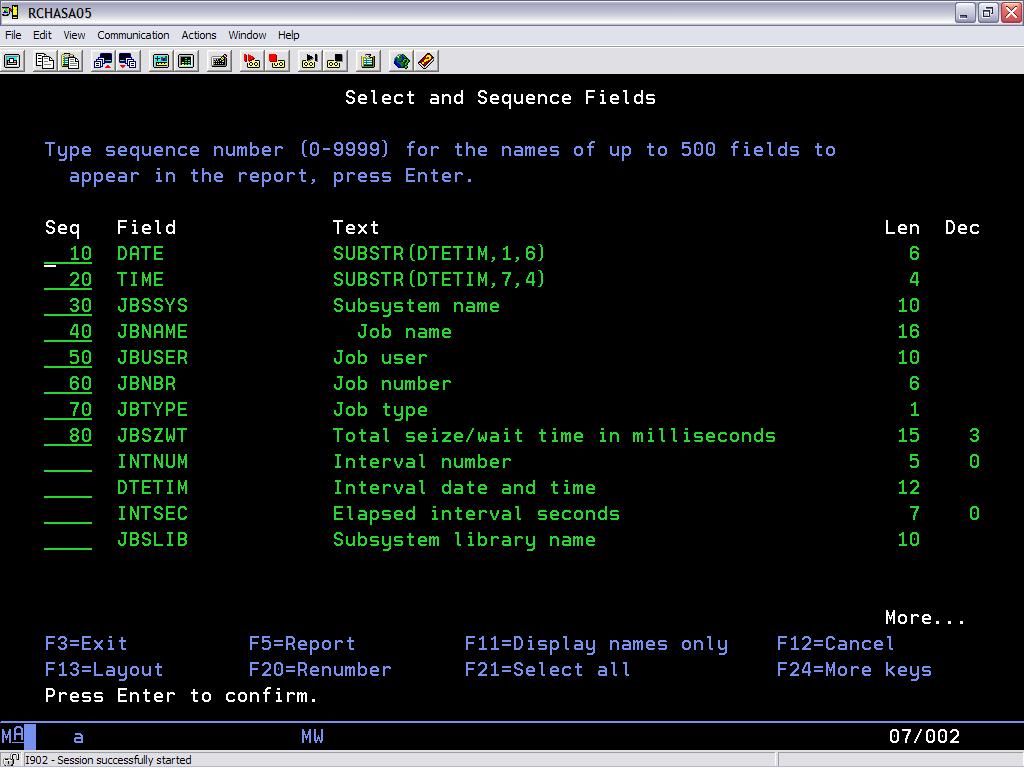
Select the sequence of fields shown in Figure 3:
Figure 3: Select a sequence of fields.
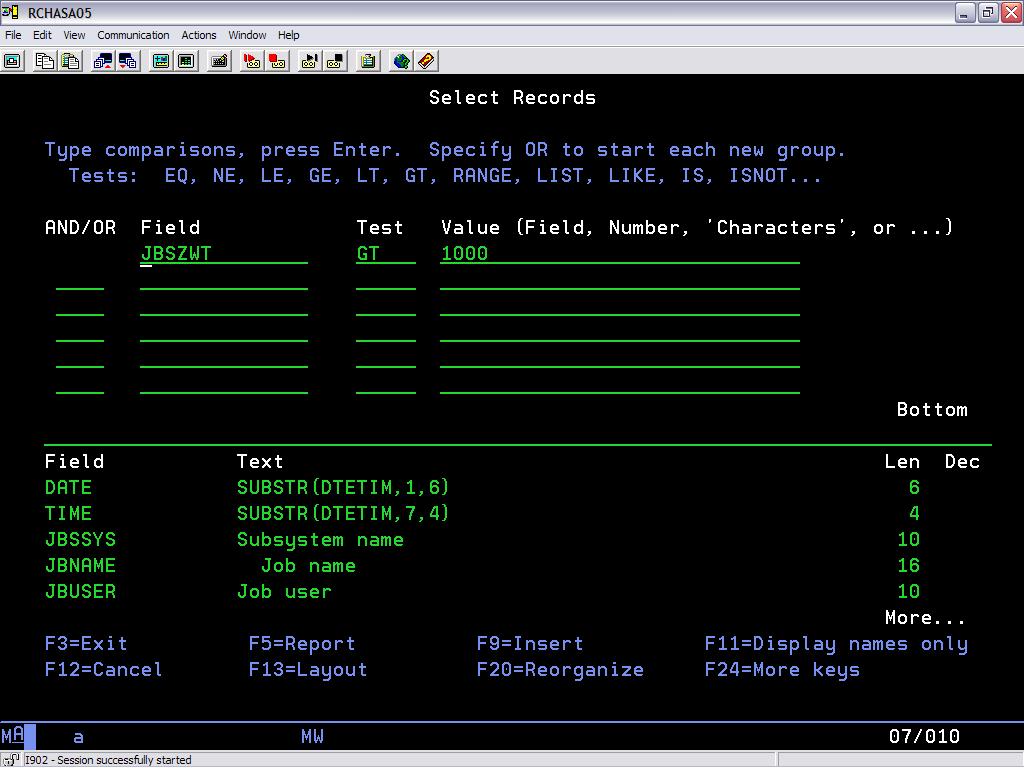
On the Select Records panel (Figure 4), enter the JBSZWT field and look for JBSZWT records GT 1,000 to find jobs with a seize/wait time of greater than 1,000 milliseconds. This eliminates jobs with very short seize/wait times, which occasionally occur but aren't significant enough to worry about.

Figure 4: In the Select Records panel, set values to look for jobs with a seize/wait time of greater than 1,000 milliseconds.
You can sort by JBSZWT in descending order to get the highest seize/wait times first, or you can sort by job name or time. It depends on how you want to look at the data. If you sort by time in ascending order, you can see what time of day the high seize/wait times are occurring. This will help you to narrow down the timeframe for which you need to run the more detailed performance analysis.
Interpreting the Query Results
The table below shows the results of the sample query. The performance data collection interval for this particular example was the default of 15 minutes. The seize/wait times are displayed in milliseconds. You'll have to do a little conversion work here. In this example, the conversion is done for you. You can see that during a 15-minute interval at 0545, some jobs waited on a particular object for over nine minutes. This amount of seize/wait time is significant.
| Query Results | |||||||
| Date | Time | Subsystem Name | Job Name | Job User | Job Number | Job Type | Total Seize/Wait Time |
| 050104 | 0545 | SBSXYZ | Jobxyz | Userabc | 321419 | B | 578,904 (9.64 min) |
| 050104 | 0545 | SBSXYZ | Jobabc | Userdef | 320063 | B | 575,163 (9.58 min) |
| 050104 | 0545 | SBSXYZ | Jobdef | Userghi | 319944 | B | 564,288 (9.40 min) |
| 050104 | 0545 | SBSXYZ | Jobxyz | Userabc | 320211 | B | 563,520 (9.39 min) |
| 050104 | 0545 | SBSXYZ | Jobxyz | Userxyz | 321364 | B | 559,112 (9.32 min) |
Focusing on the Problem
At this point, you know that high seize/wait times are occurring on your system; however, you don't know why the jobs are waiting, what object the jobs are waiting for, and which jobs are holding the object that is needed. There are two tools that provide similar types of information to assist you in finding the answers to these questions. These tools, the PEX Analyzer and the Job Watcher, are included in the iDoctor for iSeries set of advanced performance tools. This document isn't meant to provide you with the details of how to use these tools, but rather to point out to you that they can provide you with the detailed information you need in order to answer your seize/wait conflict questions.
The PEX Analyzer includes a function called a "task switch trace" that provides detailed analysis of all jobs/tasks on the system or specific jobs/tasks and picks up where the PM/iSeries400 and Performance Tools products leave off. It provides a low-level summary of MI program call flow, program and procedure CPU usage, object I/O activity, and fault analysis.
Note: Because a PEX Analyzer task switch trace collects a large amount of data, it should be run only for very short periods of time on larger systems and not over all jobs/tasks on the system ("short" meaning approximately one to three minutes).
Job Watcher is a tool similar in sampling function to the system commands WRKACTJOB and WRKSYSACT. But in addition to providing this sampling type of information, it is excellent for providing seize times and a breakdown of what types of waits occurred for all jobs or a particular set of jobs. You can drill down for the details while the watch is in progress or after the watch has ended. You can also get details on the object being waited for, the holding job, and the duration of the wait.
Solving Conflicts
You should now have a better understanding of what seize/wait conflicts are, how they can affect the performance of your system, how to identify the jobs by running a simple query on your system, how to identify the holder and the object(s) they are waiting for, and what advanced performance tools are available to assist you in answering these questions.
Sandi Chromey is a Senior IT/Architect Specialist with IBM Global Services. She provides iSeries performance support to both internal and external customers within IBM Global Services. Sandi has been with IBM for 23 years, of which 12 years have been in IT. She also has experience in iSeries development and component test.


LATEST COMMENTS
MC Press Online