One of the trickiest metrics for any IBM i partition is performance of web workloads. Luckily, there's an app for that.
Over the last few years, IBM has been pumping more and more features into IBM Navigator for i, the strategic systems management utility for IBM i. Performance analysis is one area that has been given extensive focus with Performance Data Investigator. You might launch a web service but not know how to analyze performance, let alone know where to tune it. Hidden away in the IBM Web Administration utility since V5R3 is a great little tool called Web Performance Advisor.
Web Performance Advisor analyzes the performance of a specific web environment. Based on the performance evaluation, recommendations are made that allow you to tune the performance of this web environment. It's a consolidated interface, so you can view a number of attributes pertaining to the overall partition, web environment, associated Java Virtual Machine (JVM), and database.
To access Web Performance Advisor, open up IBM Navigator for i, which is by default running on http://yourserver:2001. I've mentioned it before, and I can't stress it enough: please use a fully qualified address like partition1.yourdomain.com, and make sure the address is in your DNS.
Log on using a profile with elevated privileges and then click on Internet Configurations on the bottom left of the navigation pane. Then, click on IBM Web Administration for i. The Web Administration for i utility will open up in a new window.
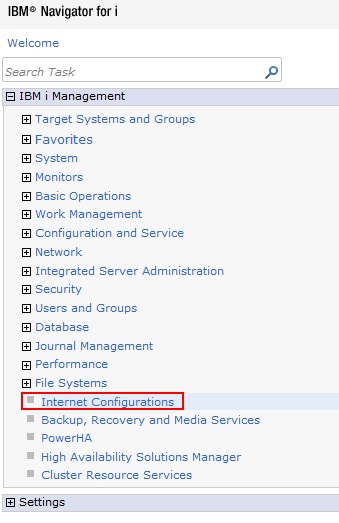
Figure 1: Choose IBM i Management > File Systems > Internet Configurations.
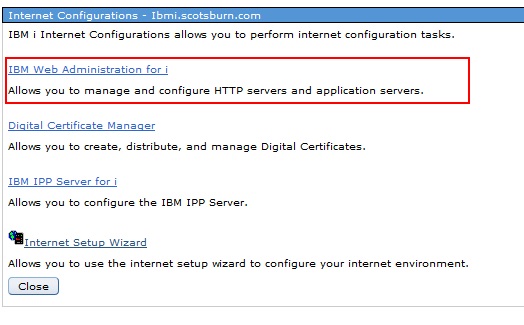
Figure 2: Select IBM Web Administration for i.
Once you're inside IBM Web Administration for i, click Manage > Application Servers, and select an application server you want to analyze. On the left side is the application server properties pane. Underneath Web Performance, click Web Performance Advisor.
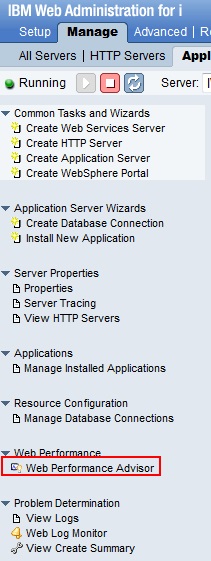
Figure 3: Launch the Web Performance Advisor.
You'll then get a pop-up window that's a little bit of a disclaimer stating that the program will recommend solutions but may not take into consideration all aspects of a particular environment and that due diligence should be taken to ensure you make the right choices for your systems. This is a complementary tool to IBM Workload Estimator and, in my opinion, to Performance Data Investigator, so don't rely on it as a complete performance adjustment solution.
The main interface for Web Performance Advisor (and remember, this is for one particular web application) gives you an overall evaluation at the top and then a section for System Performance Attribute Information and Web Environment.
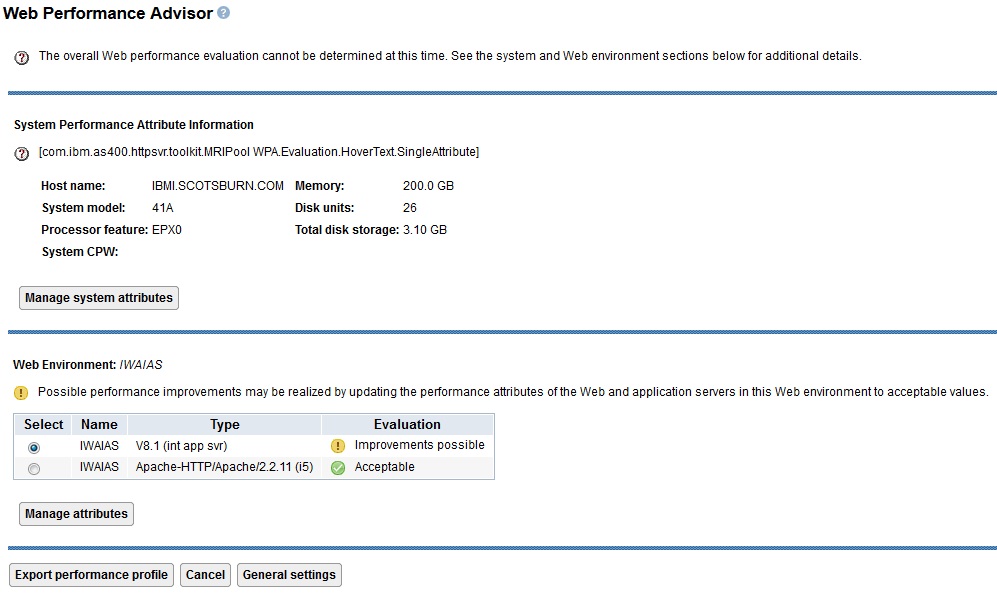
Figure 4: Click the Manage System Attributes button.
Click the Manage System Attributes to get an idea of the system-wide analysis and recommendations. The first tab, called System Resources, gives you the model, processor feature code, and system Commercial Processing Workload (CPW) rating. It also shows you the active processor cores, the virtual processors, and the type of processor sharing you have. Processor sharing has three separate settings:
- Dedicated—The physical processors allocated to this partition aren't shared with any other partition.
- Shared capped—The partition shares the physical processors with other partitions. Because "Shared capped processor" is specified, this partition cannot exceed the active processors allocated to this partition.
- Shared uncapped—The partition shares the physical processors with other partitions. Because this partition is running uncapped, this partition can exceed the active processors allocated to this partition and use processing cycles from other shared partitions that don't need their processor cycles.
Also on the System Resources tab is information on the amount of disk drives/arms and the condition of the drives. If the disk units are running in a degraded condition, the performance of this system is impacted. For example, if the write cache battery fails, the condition of the disk unit is degraded. Another example is a RAID-controlled disk unit array with a failed unit. If you have cache batteries and one or more are in an error state, you're probably going to know about it before you're mucking around with web performance. In that scenario, you're going to hear from your users when the entire system is running slowly because there's no write cache.
The Performance Settings tab makes recommendations on values for system performance (processor multitasking, parallel processing degree, thread resources adjustment, performance adjustment), thread resources affinity (group and level), maximum activity level threads, and the send/receive TCP/IP buffer sizes.
There are also tabs for PTF Groups and Web PTFs, showing the group PTF levels and web-related individual PTFs that are grouped by licensed program. Pretty handy.
Back on the main screen, you can click the Manage Attributes button underneath the Web Environment section.
On the Manage Web Environment Performance screen you have four tabs:
- JVM Settings – Displays the Java version, which JVM you're using and the bitness, Java compiler (jitc, jitc_de, Interpret), memory pool size, initial and max JVM heap sizes. It will show you if you're in debug mode and garbage collection settings.
- Resources – Displays the subsystem, memory pool name and size, the maximum active threads, and JVM heap sizes for the Integrated Web Application Server System Resources and the minimum/maximum threads and process priority for the IWAS container settings
- Database – work with associated database properties, like connection pooling.
- Additional Settings – You can turn on connection tracing and set the maximum amount of keep-alive session.
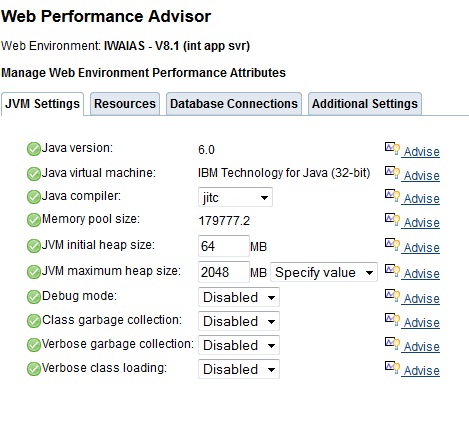
Figure 5: Check your JVM settings here.
Let's go back to the main screen once more.
At the bottom of the screen, you have a button to export an XML performance profile, which could be handy if you want to troubleshoot with IBM support or perhaps if you want to have a checkpoint of the performance characteristics in case you made changes; that way, you could compare performance before and after.
The other button at the bottom to take note of is for General Settings. First, you should unclick the check box that gives you that pesky disclaimer pop-up message. It would be better if that check box was on the pop-up window itself, but it's not, and that's how you turn it off. Second, there's a section called Specify Risk Model, where you can choose how Web Performance Advisor makes recommendations. The default setting is that the recommendations are relatively conservative. You can tune a little more granular if this setting is set to aggressive recommendations. Please note that the actual recommendation may not change, however. For example, instead of a little yellow warning sign, you will get a little red circle with an "X" stating that a parameter is outside the recommended value.
That's it. It's a relatively simple tool.
Once you make your changes, simply restart your web application server instance. If it's a system change, then of course you're bound by the activation rules of that system parameter.
In writing this article, I took a good look at all my web application servers and found a couple of settings that would be quite useful. For instance, I'm not a database guy, but I should really care about parallel processing (system value QQRYDEGREE). Mine was set to *NONE because the Licensed Program wasn't installed. That's 5770SS1 option 26 - DB2 Symmetric Multiprocessing, by the way. After doing a quick search about this product, I think it's something we should install and set to *OPTIMIZE during off hours (at first) to see if system query performance increases.
When you start using new tools, they can help you familiarize yourself with things about the IBM i operating environment you're not always up to speed on. If you use a good deal of web application servers and want to get a handle on performance, give Web Performance Advisor a try.


LATEST COMMENTS
MC Press Online