"Sometimes you're a bug, and sometimes you're a windshield."
--Price Cobb
"A sufficiently advanced bug is indistinguishable from a feature."
--Rich Kulawiec
Double quotes (so to speak)!
This is a packed article. First, I'm going to address debugging in WDSc, with the idea of making you the windshield. This topic is coming to you by popular demand; a number of you wrote in after my last column and asked me to address debugging, and since I write for you, your wish is my command.
I also want to talk about a couple of tangential issues regarding WDSc support and whether or not WDSc really is a reasonable replacement for SEU. I hear two major complaints about WDSc: it's too big and slow, and it's too buggy. I'd like to address at least the latter issue with some recent experiences. Some of the news is good, some not quite as good.
But first, let's squash some bugs!
A Few Quick Steps
What am I going to do here? I'm going to create a library, a source file, and a couple of members. I'm going to edit two programs, one that calls the other. I'm going to set a breakpoint in the second program and then submit a call to the first in batch. Then, I'm going to run through the debugging process, one step at a time.
Let's Connect
We don't have a lot of room, so I'm going to have to shortcut a few of the steps, but bear with me. First, I fire up WDSc on a new workspace. This will default me to the Remote Systems Explorer (RSE), which is where I want to be. I'll create a connection to my iSeries by expanding the iSeries option in my New Connection menu (Figure 1):
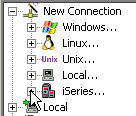
Figure 1: Clicking on iSeries will prompt for iSeries connection information. (Click images to enlarge.)
Now a Library
I create a connection called "pbd270," which happens to be my machine's name. (I assume you've done at least this much; if not, drop me an email and I'll give you more information.) Next, I'll create a library. I expand the pbd270 and then right-click on the iSeries Objects option. I then select New > Library... from the resulting context menu (Figure 2).

Figure 2: To do something on the iSeries, you usually right-click on an option in the connection.
The Create Library dialog is a typical prompt (Figure 3):
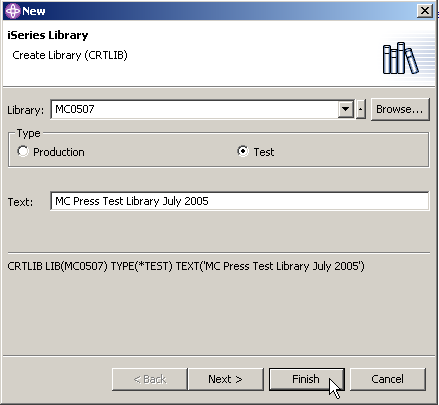
Figure 3: The Create Library (CRTLIB) prompt is typical of an iSeries prompt dialog.
One of the things I like about these command dialogs is that, as I type values into the parameters on the dialog, the resulting command is built in the lower section of the command dialog. This is similar to what you see when you hit F14 when you're prompting a command in the green-screen.
Note: If you're following along with this article, you haven't yet logged in to the iSeries. When you hit Finish, you'll be prompted for your profile and password.
Keeping Current
An important point is that, since this library never existed, it certainly is not in your library list. You can modify your connection to include this new library at startup time, and you should probably do that if you plan to use this library as part of your normal development. However, there's a quick and easy way to do this for the short term: You can directly manipulate your library list. Under iSeries Objects is an option called Library list. Right-click on it and select Add Library List Entry....
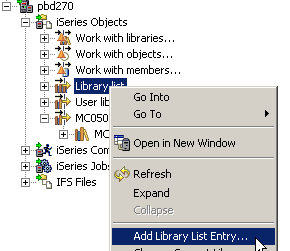
Figure 4: Right-click on Library list to directly manipulate the connection's libraries.
This will cause another prompt. Enter the name of the new library and press Finish.
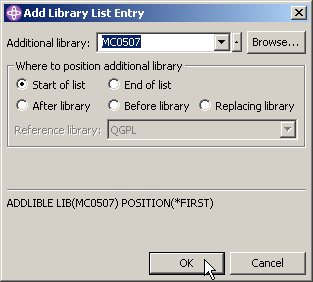
Figure 5: This is how you add a library to your connection.
Adding the Source Members
If I walked you through every screen, I'd run out of room in this article before we ever entered a line of code, and that's not going to help. So instead, I'll tell you what you need to do:
-
Expand the MC0507 library (you'll see something called MC0507.*lib.test).
- Right-click on that new object and select New > Source Physical File.
- Use the dialog presented to create a file called QSOURCE.
- Right-click on the newly created source file and select New > Member.
- Create an RPGLE member called MATH (this will bring up an empty RPG editor).
- Repeat steps 4 and 5 to create a member called CALLMATH.
Enter the following code for each:
MATH:
d Input2 s 5u 0
d Operation s 1a
d Result s 5u 0
/free
select;
when Operation = 'A';
Result = Input1 + Input2;
when Operation = 'S';
Result = Input1 - Input2;
when Operation = 'M';
Result = Input1 * Input2;
when Operation = 'D';
Result = Input1 / Input2;
endsl;
return;
/end-free
CALLMATH:
d Op1 5u 0 const
d Op2 5u 0 const
d Opcode 1a const
d Result 5u 0
d RPlus s 5u 0
d RMinus s 5u 0
d RMult s 5u 0
d RDiv s 5u 0
d Msg s 50a
/free
Math(4: 5: 'A': RPlus);
Math(4: 5: 'S': RMinus);
Math(4: 5: 'M': RMult);
Math(4: 5: 'D': RDiv);
Msg =
('A: ' + %char(RPlus) +
', S: ' + %char(RMinus) +
', M: ' + %char(RMult) +
', D: ' + %char(RDiv));
dsply Msg;
*inlr = *on;
/end-free
There's a little fun here for everyone. Note that I'm using free-form calculation specs. I'm using a prototype for a program-to-program call. I'm using the "select" and "dsply" opcodes. If any of these cause questions, please feel free to ask them in the forums discussion associated with this article. In the meantime, though, I'd like to give you a brief explanation of what's supposed to happen here.
The program CALLMATH is supposed to call the program MATH four times, each time performing a different operation (add, subtract, multiply, and divide) on the values 4 and 5. The results are stored in four fields (RPlus and so on), which are then finally displayed to the caller using the dsply opcode. If you run this from a green-screen and then display your joblog, you will see something like the following:
Library MC0507 added to library list.
3 > call callmath
DSPLY A: 0, S: 0, M: 0, D: 0
Interestingly enough, all the values are zero, and that's not exactly what we expected. So now it's time to debug the application to find out what went wrong.
Setting the Breakpoint
First, you need to set a breakpoint. You'll need to bring up the source for CALLMATH if it's not already up, and then you set a breakpoint by double-clicking in the gray area to the left of the line where you want the breakpoint.
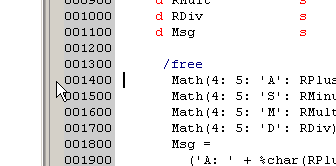
Figure 6: Set a breakpoint by double-clicking to the left of the preferred line.
You'll be prompted for a bit more information, primarily the library name of the program you are attempting to breakpoint. Enter in MC0507 and hit Finish, as shown in Figure 7. A blue ball will then appear to the left of the statement, as depicted in Figure 8.
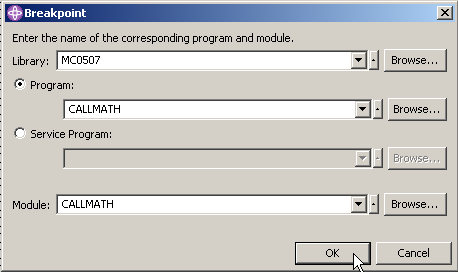
Figure 7: You must specify the fully qualified name of the program.

Figure 8: Once you've done that, a small blue ball indicates that the breakpoint has been set.
Running the Program
Now, you must launch the program. One way is to use the default capabilities of the launch buttons. Near the top of the workspace, you'll see a running man icon and a little bug icon (there's also what looks like a running man with a suitcase). To the right of each of these buttons is a small drop-down list button. Make sure you have selected CALLMATH in the Remote Systems view, and then click the drop-down button to the right of the bug:
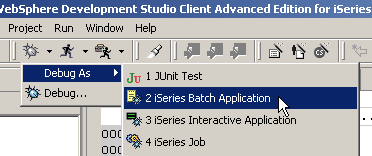
Figure 9: The drop-down list to the right of the bug brings up this menu.
Select Debug As > iSeries Batch Application. This will do all kinds of things. First, it will switch you to the Debug perspective. Next, it will submit a call to CALLMATH. Note: In order to perform debugging, the user profile you signed on with must have enough authority to use the STRSRVJOB command.
The Debug Perspective--Program Execution
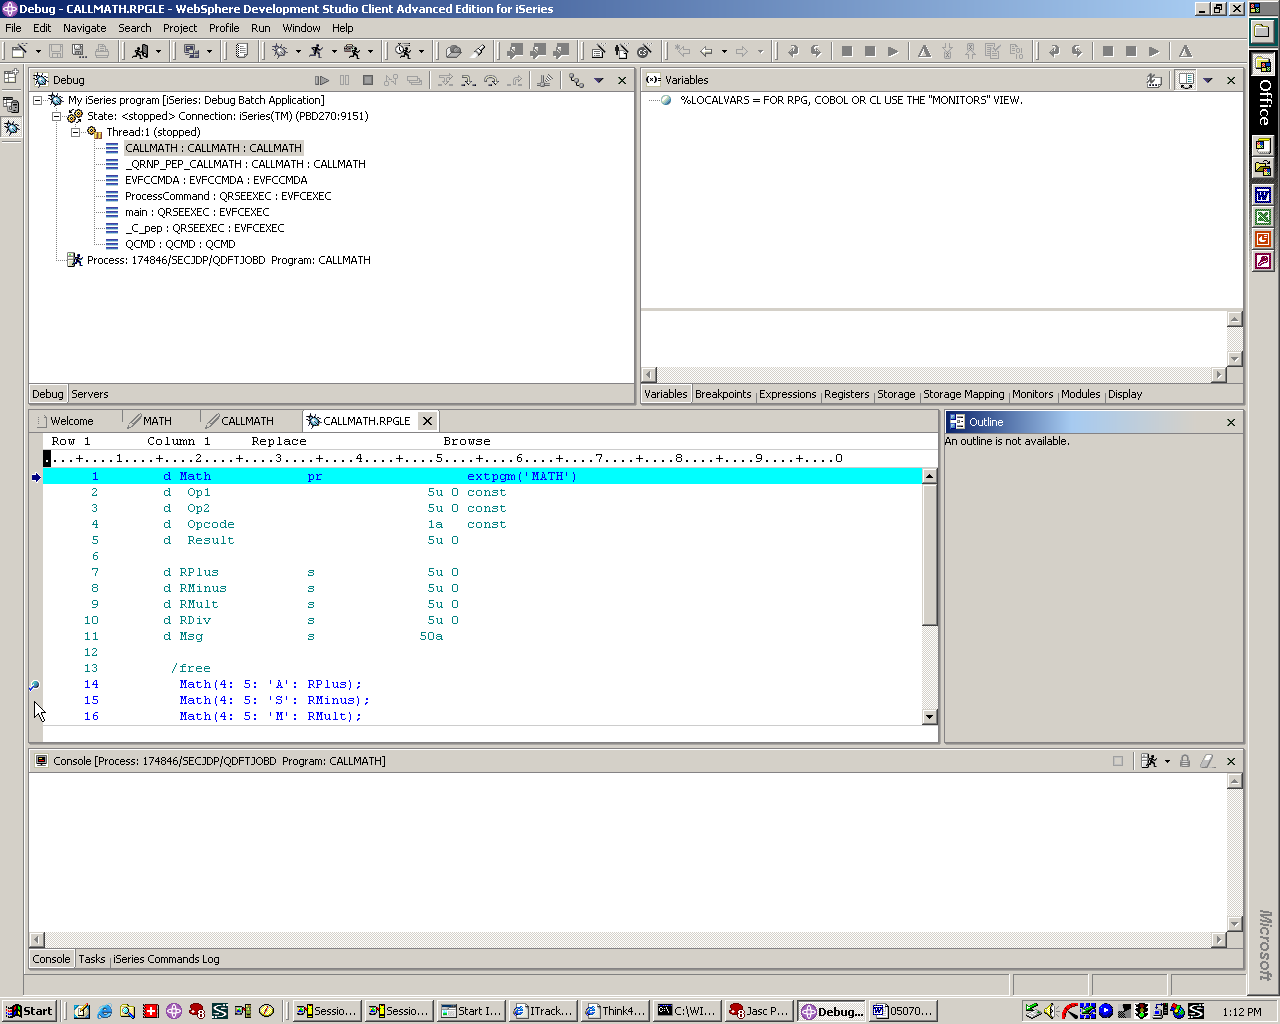
Figure 10: This is the Debug Perspective.
From here, you can do a number of things. You'll see a small blue "switch" to the left of statement 14; this is the breakpoint you set in the Edit perspective. The highlight line at the top of the source member means that your program was halted before it executed any of your source code. Near the top of the workbench is the Debug view, and in it are the buttons that allow you to control program execution. Figure 11 shows how to resume the program. Resuming causes the debugger to execute the program until it hits a breakpoint. Execution will stop prior to the line executing, with the line highlighted as shown in Figure 12.
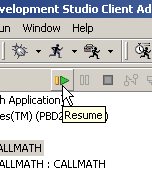
Figure 11: Clicking the resume button causes the program to run to the next breakpoint.

Figure 12: The highlighted line indicates the next line to execute.
At this point, CALLMATH is going to call the program MATH. The Math prototype is similar to a CALL opcode, because the prototype has been defined with the EXTPGM keyword. Although a discussion of this topic is outside the scope of this column, I thought you might like to see how to define a prototype to an external program; it's quite simple. Debugging that program is just as simple; press the Step Into tool as shown in Figure 13.
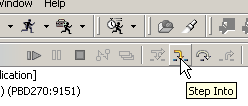
Figure 13: The Step Into button steps into procedures or even into called programs.
The view will change to the called program MATH:
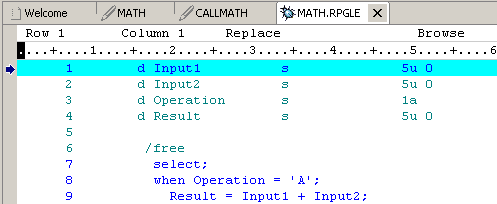
Figure 14: You're now at the beginning of the called program.
Use the Step Over button to get to the first line of the program:

Figure 15: Press Step Over to get to the first executable statement of MATH.
And at this point, you can inspect the variables.
Debugging the Program
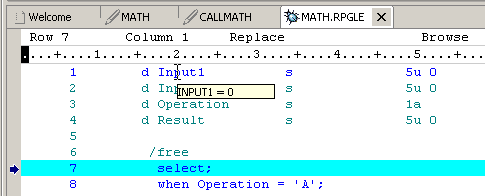
Figure 16: The anomaly presents itself!
To see the contents of a variable, simply move your cursor over it, and the value will pop up. In Figure 16, you can see that you're at the first statement of the program, yet none of the values (Input1, Input2, Operations) are set. This is the quandary: Why in the world don't these parameters have values?
Oh, wait! Are they really parameters? Closer inspection indicates that one thing is missing: the *ENTRY PLIST that will cause Input1, Input2, Operation, and Result to be treated as parameters. Add the code:
c parm Input1
c parm Input2
c parm Operation
c parm Result
Now your program is ready to roll.
Change the program, recompile, and relaunch it by hitting the Debug button again. This time, you'll get an error about the receiver being too small to hold the result; I'll leave this as an exercise to the reader. If you want to know what the cause is, drop a line in the forums and I'll walk you through the rest of the issues. (Hint: Unsigned variables don't like negative numbers.)
The point is that it's relatively easy to create programs (even programs that call other programs), set breakpoints, and walk through the execution of a program all via WDSc. You can easily examine variables (I didn't show this to you, but you can also change them!), and this will allow you to find your bugs quickly and easily.
The editor has a lot more features, by the way. This column didn't really touch on verifying and compiling code, nor did it address offline coding. If any of those are topics of interest to you, please send me an email, and I'll see if I can follow up in a later article.
New News
To this point, you've just been taking a look at WDSc from my personal point of view. Since I'm a big fan of the product, you might worry that there's a wee bit of bias. To alleviate that, I'm going to give a little news from the outside world.
Version 5.1.2.5 of WDSc Has the Right Stuff
First is a bit of positive news. Well, to be honest, how positive it is may depend on your perspective. But here's the news: IBM recently released Version 5.1.2.5 of WDSc. Just the act of releasing a new edition of the 5.1.2 version is a good thing, as the reports on WDSc 6.0 are not exactly scintillating (this is strictly hearsay; I haven't gotten a look at the new package, so I can't tell you from experience). More to the point, though, is what's in the new release, and that's primarily a whole lot of fixes to the CL editor.
Why is this a good (or bad) thing? Well, starting with the negative, it means that the CL editor needed a lot of work. But I don't think that surprises any of us who used it. The CL editor had a number of quirks and outright bugs that made it clear that nobody who actually wrote a lot of CL ever tested the code. But despite past issues, the new version fixes a whole raft of things that made the CL editor difficult to use. And that's not all; a number of usability issues were addressed, including simple things like being able to include a single apostrophe in message text when editing a message file (thanks, IBM--we all know just how annoying apostrophe handling can be!). But no matter how you look at it, the WDSc team is doing a great job of squashing bugs.
DeveloperWorks Not a Nice Neighborhood for iSeries Developers
On a somewhat more negative point, it seems that the folks at DeveloperWorks no longer consider the iSeries a development tool. Specifically, I recently asked a question there about a bug in WDSc and (after two weeks of pestering) was told basically to go take a hike:
"This forum is a best effort support forum for middleware. Product specific support and development teams do not monitor the forum. I am not aware of an evaluation copy of WDSc, if I am not mistaken the software is iSeries specific and you should have an IBM support contract for this software."
The gist of this response is that WDSc is an iSeries product, and DeveloperWorks doesn't do iSeries. Get a support contract and stop bothering us.
This is an awfully bizarre response on a number of levels, not the least of which was the fact that my problem was with the WSAD portion of WDSc, which does indeed have an evaluation version. But more importantly, since when does DeveloperWorks not support iSeries developers? Evidently, the idea of the iSeries Initiative hasn't been relayed to the DeveloperWorks staff. I know IBM is a big place, but this seems to be a rather large oversight.
The End of the Day
Anyway, at the end of the day, I'm still pretty excited about WDSc. It's a great tool, and it makes my life developing code a lot easier. I haven't spent a lot of time yet working with service programs; if you'd like more information about those, please drop me a line. As I said at the beginning of the column, this space is supposed to be for and about you, so please let me know what you need.
Joe Pluta is the founder and chief architect of Pluta Brothers Design, Inc. He has been working in the field since the late 1970s and has made a career of extending the IBM midrange, starting back in the days of the IBM System/3. Joe has used WebSphere extensively, especially as the base for PSC/400, the only product that can move your legacy systems to the Web using simple green-screen commands. Joe is also the author of E-Deployment: The Fastest Path to the Web, Eclipse: Step by Step, and WDSc: Step by Step. You can reach him at This email address is being protected from spambots. You need JavaScript enabled to view it..


LATEST COMMENTS
MC Press Online