It's super easy, and even better, it's free!
Here's the challenge: How do you monitor your IBM Power Systems' CPU usage without using commercial tools, operating system agents, or SNMP?
The answer is the free, open-source LPAR2RRD package. It does exactly that and offers a lot of additional unique features as well.
The tool creates CPU and MEM utilization graphs in a highly virtualized environment. Figure 1 shows a typical graph example.
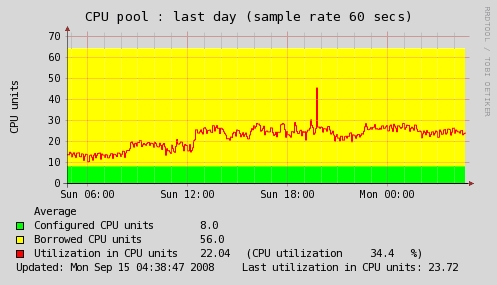
Figure 1: This graph shows the total CPU utlization of 64 cores on an IBM i Power Systems box for 24 hours.
It's all focused on usage simplicity (you should get the information you're looking for in 2 – 3 mouse-clicks) and easy management (the tool recognizes every change in your virtual environment and applies that internally).
As it is agentless, it doesn't require installation agents on monitored virtual partitions. Therefore, it's independent of the OS running on LPARs and supports everything that might run on IBM Power.
One of the major additional features is the CPU Workload Estimator, which simulates current CPU load and predicts CPU load on other IBM Power hardware, based on stored historical utilization data and rPerf or CPW benchmarks.
You might use LPAR2RRD stored data for further import into other tools via CSV export.
Notification alerts of CPU overload are delivered via the tool itself or via third-party software, such as Nagios.
So How Does It Work?
The HMC collects CPU utilization data from all managed IBM Power Systems machines directly from the Service Processors via the private network. LPAR2RRD uses the standard API on the HMC to get CPU utilization data, transfers it via ssh to the hosted server, and stores it in RRDTool files. Then data is presented graphically via the web GUI.
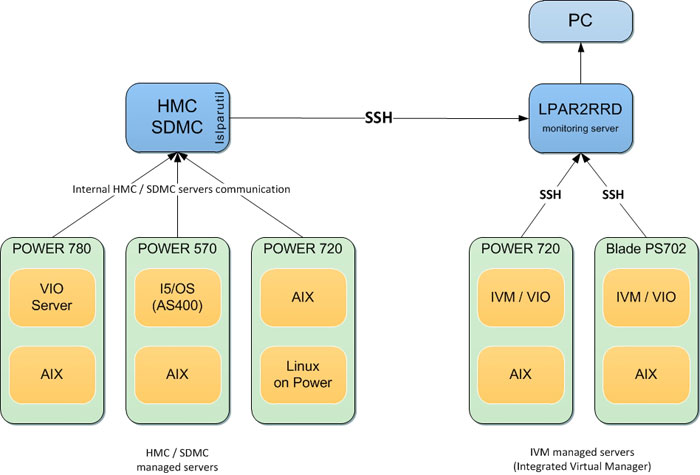
Figure 2: See how it works.
CPU Workload Estimator
CPU Workload Estimator acts as pre-check for migration of logical partitions to already existing or new physical hardware. Using simple graphics based on historical data, it can answer your questions about whether the CPU load of migrated partitions will fit the target hardware. Calculations are done based on official IBM benchmarks rPerf or CPW.
Usage is very simple, requiring just a few clicks to get the necessary report.
Example 1:
Migration of six existing LPARs on three different boxes to new IBM Power 710 (just a test to see if that hardware can handle the CPU load of those six LPARs).
It works with last week's performance data (you might select other time ranges).
Based on the rPerf benchmark…
- The target server has 45 rPerfs.
- All LPARs together use 80 rPerfs in the highest peak.
The graph shows that in the case of such a migration, the target hardware cannot handle such a CPU load!
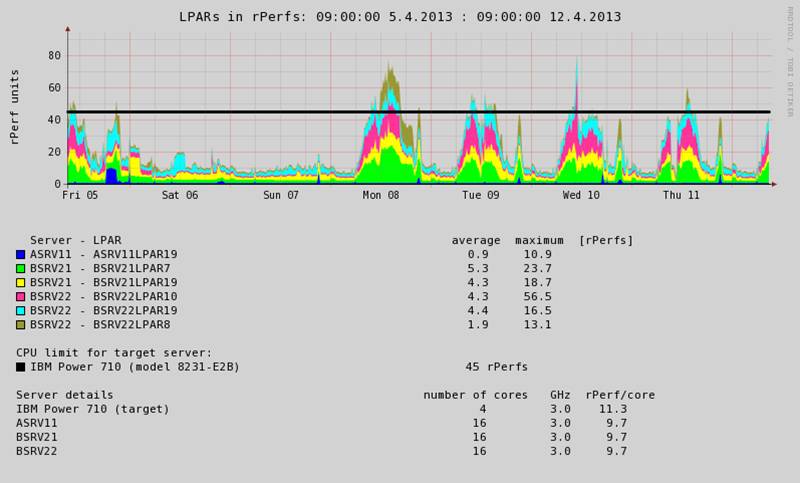
Figure 3: The target hardware won't be able to manage the load.
Example 2:
Migration of four LPARs to an existing IBM Power 750 that is already running some CPU load.
Based on the rPerf benchmark…
- The target server has 127 rPerfs.
- The target server is already running a CPU load of about 50 rPerfs in a peak (red area).
- All LPARs together use nearly 50 rPerfs in a peak.
- The combined existing and new loads will be in the highest peaks, about 100 rPerf.
The graph shows that in the case of such a migration, the target hardware easily accepts the new CPU load!
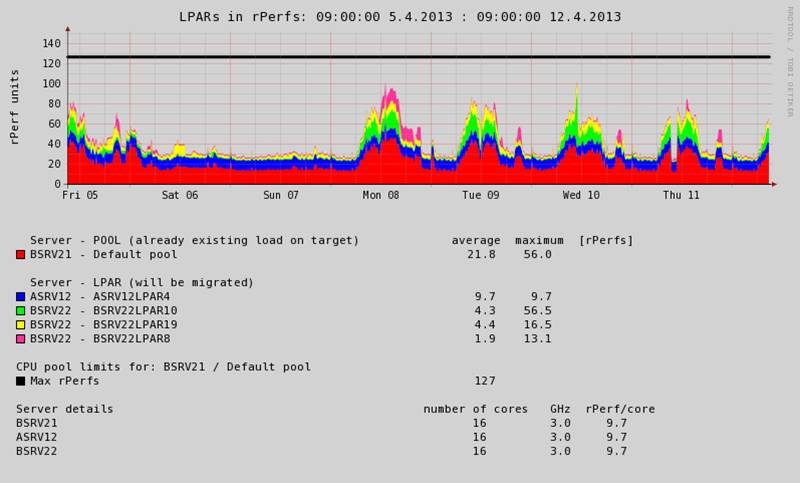
Figure 4: The CPU Workload Estimator shows that the hardware can definitely manage the load.
The CPU Configuration Advisor is a batch job that once a day identifies LPARs or CPU pools with the wrong CPU setup.
It does its job based on...
- Actual LPAR and CPU pool setup
- Maximum CPU peak reached in a given time range
- Average CPU load in a given time range
It suggests the following changes:
- CPU entitlement
- Number of logical (virtual) CPUs
Note that a bad CPU logical setup might lead to performance degradation.
Click here for more details and examples.
Live Partition Mobility (LPM)
The Live Partition Mobility (LPM) support virtualization feature is natively supported by the tool.
When you use LPM, you can easily track how your LPAR was running in your chosen time frame and what CPU resources it consumed on different machines. All of that in one graph!
Example:
In the graph below, you can see the LPAR called aix1, which was running on three different physical servers over two weeks.
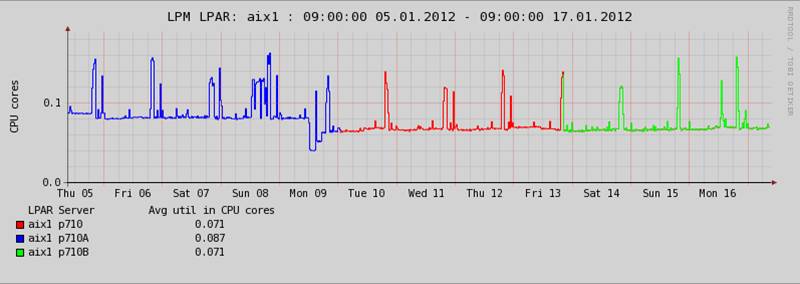
Figure 5: The LPAR called aix1 ran on three different physical servers over two weeks.
Custom Groups
Do you want to group LPARs or CPU pools from different boxes to get an overview of how much CPU they consume totally from an application point of view?
Custom groups allows you to group whatever what makes sense:
- Applications
- OS clusters
- Application clusters
Example:
The graph below shows the total CPU utilization of six physical servers during the past week.
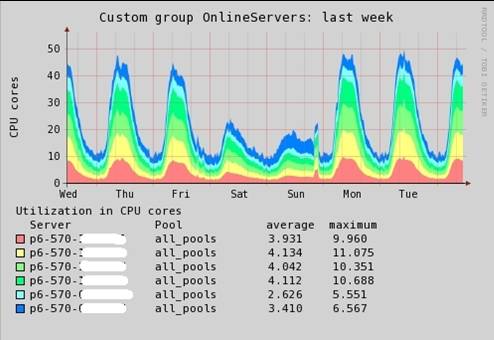
Figure 6: This graph shows the total CPU utilization of six physical servers during the past week.
These are some practical examples of what can be grouped:
- All production Oracle DB LPARs (or Oracle RAC nodes per a database)
- All WAS application LPARs
- All development servers/LPARs
Again usage and configuration are simple. You'll get results with just two mouse-clicks.
LPAR2RRD Software Information
LPAR2RRD is free software released under the GNU GPL v3 license. Optionally, you might order It's super easy, and even better, it's free!
Test LPAR2RRD's features on this live demo.


LATEST COMMENTS
MC Press Online