Now that you know the debug views at your disposal and learned how to encrypt your debug views, it’s time to start a good and proper debug session with the ILE Debugger.
Once you create your objects with the appropriate debug view, you’re ready to debug them. You probably guessed that the process is initiated with strdbg. Let’s start with a debug session of a simple program built to test some of the date-handling functions from the “BIF Up Your Code” subseries, named TST_DTEOPS, which you can download here.
Just a side note before we begin: even though I prefer the *list view, I’ll use the simpler and somewhat “cleaner” *SOURCE view for this walkthrough.
So, to start the debug session, you just need to enter the following command, where MYLIB is the library to which you decide to restore the program:
STRDBG PGM(MYLIB/TST_DTEOPS)
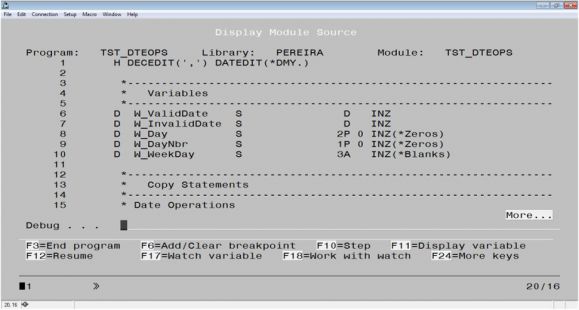
The Display Module screen will be displayed, as shown in Figure 1. Notice, at the bottom of the panel, the debug command line (debug commands are not case-sensitive) and the function key legend. I’ll use both of these throughout the debug session. Remember, however, that ILE programs are usually composed of more than one module, so the first thing you should know about navigation is how to select modules for display.
Figure 1: The Display Module source screen
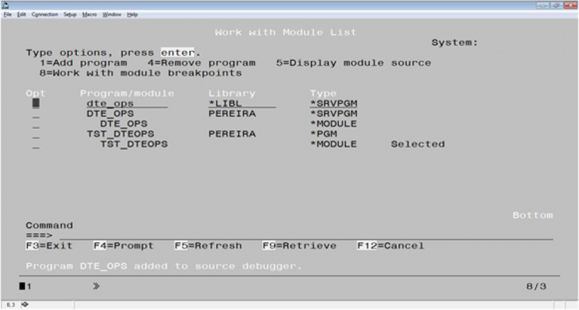
As with many debugger operations, you can use either a function key (F14) or a debug command (DISPLAY MODULE) to select from among your modules; press F14 now to display the Work with Module List panel. From here, you can select, using option 5, the module you want to display. Since our little program has only one module (TST_DTEOPS), the list only includes that module, so let’s add the DTE_OPS service program. Use option 1 and type the service program’s name. The service program and respective module will be added to the list, as shown in Figure 2.
Figure 2: A service program and respective module added to the debug session
If you want to remove a module from this list, use option 4. For now, I’ll select module DTE_OPS with option 5 and press Enter. If you’re following these steps, you should see the source for DTE_OPS on the Display Module Source panel. You can use the Page Up and Page Down keys to scroll through the source. That’s easy navigation, but when you’re working with code of a more realistic length, trying to find the area of source that interests you using only Page Up and Page Down is both tedious and time-consuming. Typically, you’ll want to view a section of source associated with a particular location, such as the beginning, the end, or a location relative to the currently displayed section, or with a particular named item, such as a variable, subroutine, or procedure. In addition, when you’ve set breakpoints in the code, you’ll often want to display the associated section of code. There are a few commands to facilitate these tasks. Some are discussed in the next section, and others are covered later in this subseries.
Navigating in the Debug Session
Let’s look at the navigational commands available, shown in Table 1.
|
Navigational Commands |
||
|
Command |
Abbreviation |
What It Does |
|
DISPLAY MODULE <modulename> |
DI M |
Displays source for module <modulename>. |
|
UP n |
U n |
Moves the displayed window of source n lines to the beginning, like a user-controlled, number-of-lines Page Up. |
|
DOWN n |
DO n |
Moves the displayed window of source n lines to the end. |
|
TOP |
T |
Jumps to the first line of the source currently displayed. |
|
BOTTOM |
BO |
Jumps to the last line of the source currently displayed. |
|
LEFT n |
L n |
Moves the displayed window of source n columns to the left; alternatively, pressing F19 moves the window 12 columns to the left. |
|
RIGHT n |
R n |
Moves the displayed window of source n columns to the right; alternatively, pressing F20 moves the window 12 columns to the right. |
|
FIND <text> <direction> |
F <text> <direction> |
Positions source to the line containing <text>. The optional <direction> parameter can be either N (“next,” the default) to search forward or P (“previous”) to search backward. |
|
FIND <line number> |
F <line number> |
Positions source to <line number> line. |
|
NEXT |
N |
Jumps to the next breakpoint in the currently displayed source. |
|
PREVIOUS |
P |
Jumps to the previous breakpoint in the currently displayed source. |
There are a few additional points to keep in mind about the find command:
- If <text> contains blanks, it must be enclosed within apostrophes; for example, F ‘= P_’ will look for an assignment or comparison involving a parameter variable.
- If you’re searching for text rather than a line number, be sure to enclose numeric values in apostrophes.
- If the cursor is located in the text, the search begins from that point. Otherwise, the search begins with the first character on the top line displayed.
- You can repeat the last FIND command executed by issuing command FIND without parameters or by pressing F16.
Now that you’ve started the debugger and seen how to select and add modules, it’s time to practice the navigational commands. For now, ignore the breakpoint-related commands in the last two rows of Table 1; I’ll return to those in the next TechTip. Stop here and go for a spin in the Display Module screen!
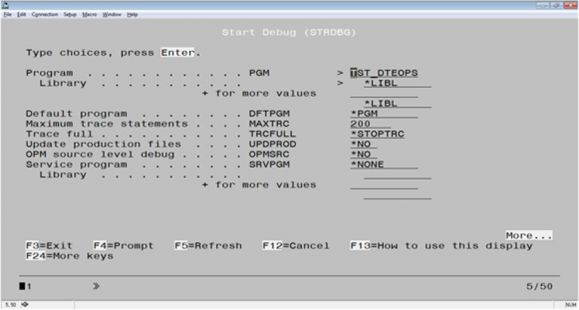
Back already? Before you actually debug a program, there are a few more things you should be aware of. When you start a debug session using the STRDBG command, you can change a few parameters, as you can see in Figure 3.
Figure 3: The STRDBG prompt screen
The most relevant options are as follows:
- Whether database files in *prod-type libraries can be changed is controlled by the UPDPROD parameter. The shipped default is *no.
- Only relevant if your debug session includes OPM programs, the OPMSRC parameter controls whether you’re allowed to debug OPM programs.
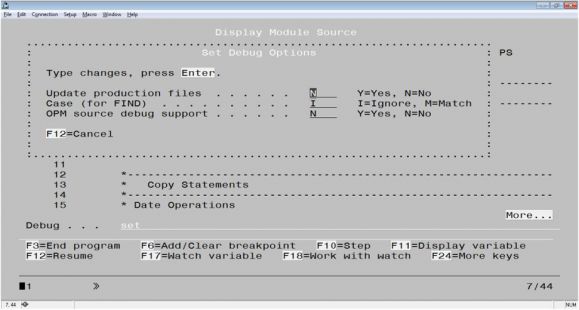
These options can be changed during your debug session with the SET command. To use this debug command, type SET on the debug command line and press Enter. The Set Debug Options window in Figure 4 will appear, and you can make your choices.
Figure 4: The Set Debug Options window
In addition to the previously mentioned options, SET also allows you to define how the text searches using FIND are performed. The default is case-insensitive (I), but you can change the value to M to force a case-match.
Coming Up: Breakpoints!
Next time around, I’ll discuss setting and using breakpoints, because just navigating on the source is not enough to solve problems. Until then, I’d like to hear what you think of this subseries: is it useful; are you actually starting to use the ILE debugger? Share your experience with your fellow programmers, using the Comments section below!


LATEST COMMENTS
MC Press Online