With the ILE Debugger, you can debug anything. This TechTip will explain how to debug service programs, OPM RPG, and CL programs!
You already know it's possible to debug a service program by adding it to the Working with Modules window via F14 during the debug session, as I explained a few TechTips ago. What you might not know is that you can also do it directly from the STRDBG command. It's simply a question of specifying the service program name in the appropriate parameter.
Debugging Service Programs
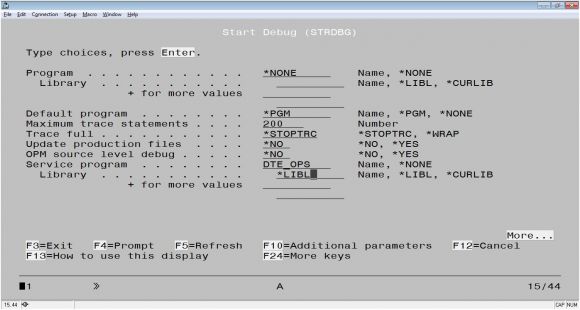
So far, we've debugged a program (TST_DTEOPS) that in turn uses functions from a service program (DTE_OPS). Now, you'll learn how to debug one of the service program's functions directly. Let's start by prompting the STRDBG command and entering the name of the service program in the SRVPGM parameter, as shown in Figure 1.
Figure 1: The STRDBG command prompt, prepared to debug a service program.
When you press Enter, you get the familiar Display Module screen, but the source is from the DTE_OPS' module. Let's add a breakpoint to LastDayOfMonth's first debuggable line (line 27) and press F12. Note that these examples use modules compiled with DBGVIEW (*SOURCE), so if you have recompiled the DTE_OPS module with another debug view, the line number will be different. Also, the line number is not the first line of the function, but the first line of the function's code.
Now call the TST_DTEOPS program from the command line. What happened? The program ran its course until the call to function LastDayOfMonth triggered the breakpoint that you added. This is particularly useful when you have an idea where your problem is, but don't quite know how the function is called. However, this can lead to complicated and time-consuming issues. When you add a breakpoint inside a function that is called often during a program's execution, make sure you specify the appropriate condition; otherwise, you might have to press F12 several times until you reach the call you want to debug. A way to circumvent this problem is by using conditional breakpoints, as explained here.
Alternatively, you can also try to use a watch condition, as discussed in another TechTip of this subseries, but it all depends on the problem at hand. Now that you know that all these tools are at your disposal, you can figure out which one is best for each situation. Naturally, there will be (many) times in which just one tool won't do and you'll have to use a combination of breakpoints and watch conditions to figure out what's happening on a certain piece of code.
Debugging OPM RPG and CL Programs
From what you've read so far, you're probably thinking, This is a great tool. It's a shame I can't use it more often! Actually, you can use it to squash bugs in OPM programs, as I mentioned earlier. You just need to specify OPTION(*LSTDBG) or OPTION(*SRCDBG) in the CRTRPGPGM command. The first one is preferable because it will also allow you to see any /COPY or /INCLUDE statements as part of the source code, just as DBGVIEW(*COPY) or DBGVIEW(*LIST) do in an ILE module compilation command (with the appropriate options). Similarly, you can use the ILE debugger to debug CL programs that were compiled with the OPTION parameter of CRTCLPGM set to (*SRCDBG). Then, all you need to do is set the STRDBG'S parameter OPMSRC to *YES when you start the debug session or use the SET debug command, explained here, to activate the OPM source debug support.
This technique can be extremely useful during OPM-to-ILE transition phases because it allows you to debug nearly anything on the call stack. Imagine that a CL is called from the menu to start a certain process, typically to clear some files or copy data around. Next, an OPM program is called by that CL to perform some tasks. Finally, one or more of these tasks needs "helper programs" that are actually ILE service programs. With the proper compilation settings, you can use the ILE debugger for all your debugging needs. Earlier in this series, you learned how to create user options in PDM to host some compilation commands. Perhaps now is the time for you to revisit those commands, customizing the DBGVIEW parameter to your view of choice and adding some user options for OPM RPG and CL programs.
Coming Up
The next TechTip will discuss an even more awesome thing you can do with the ILE debugger: debug batch jobs! Until then, feel free to share your experience, questions, and criticisms In the Comments section below or in the LinkedIn groups where my TechTips usually end up.


LATEST COMMENTS
MC Press Online